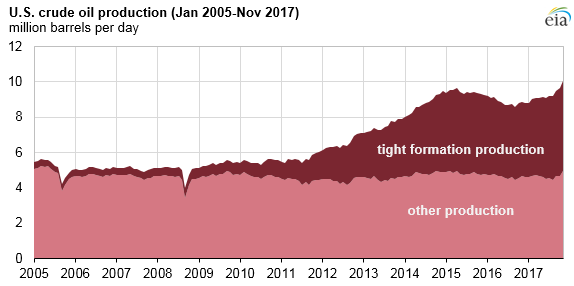
In the USA, the process of hydrofracturing (fracking) for oil and gas has produced astounding results in terms of energy produced per day from the major geological regions where petroleum and natural gas are extracted. These are the shale oil and gas fields. The oil coming out of fracked shales is called “tight” oil because it is tightly bound up with the rock formation, and the fracturing releases it and allows it to flow to the well head.
The chart below shows how rapidly U.S. oil production ramped up beginning at the end of 2008 when it stood at just 5 million barrels a day. At the time of this post, the Energy Information Agency is reporting U.S. daily production of 12.3 or 12.4 million barrels a day in total. Throughout this post we’ll refer to this period of January, 2009 – present as the “fracking frenzy.”
Both presidential administrations since 2008 have claimed that the USA is achieving “energy independence” or “energy dominance” because of the fracking frenzy. Leaving aside the validity of such claims for now, the main point of this post is to examine the downside of the fracking frenzy, which is reported in oil and gas reports as the “Legacy Wells Decline” or legacy decline.
Each month, the Energy Information Agency publishes a report called the Drilling Productivity Report, which will appear in a new window if you click the link. Because the report focuses on productivity in drilling new wells for oil or gas, you see in the right column a list of the seven shale fields where almost all new oil or gas is being extracted. The report doesn’t cover “conventional” oil regions, which are covered elsewhere and not the point of this post, either.
Each Drilling Productivity Report shows “New oil well production per rig,” on a timeline, and the count of rigs operating for that resource in that field. Below that chart is the topic of this post, Legacy oil production change, thousand barrels per day.
At this point let’s briefly touch on how much energy we are talking about. This will be important in establishing how many solar-panel equivalent megawatts, gigawatts and terawatts (trillion watts) would be needed to replace the same amount of energy, if it were even feasible. In some applications, this may never be feasible.
“The U.S. Internal Revenue Service defines a BOE as equal to 5.8 million BTU.[1] (5.8×10⁶ BTU59°F equals 6.1178632×10⁹ J, about 6.1 GJ [HHV], or about 1.7 MWh.)
Wikipedia entry on “Barrel of Oil Equivalent.”
So, a barrel of oil gives you 5.8 mega-BTU of energy, about 6.1 Gigajoules, or in terms familiar in renewable energy discussion, 1.7 megawatt-hours of energy.
Here are the legacy-decline charts for the shale oil fields reported out by the EIA:
Continue Reading in This Window

